System Diagnostics for Existing Heating Systems: Spotting Faults Before They Get Expensive

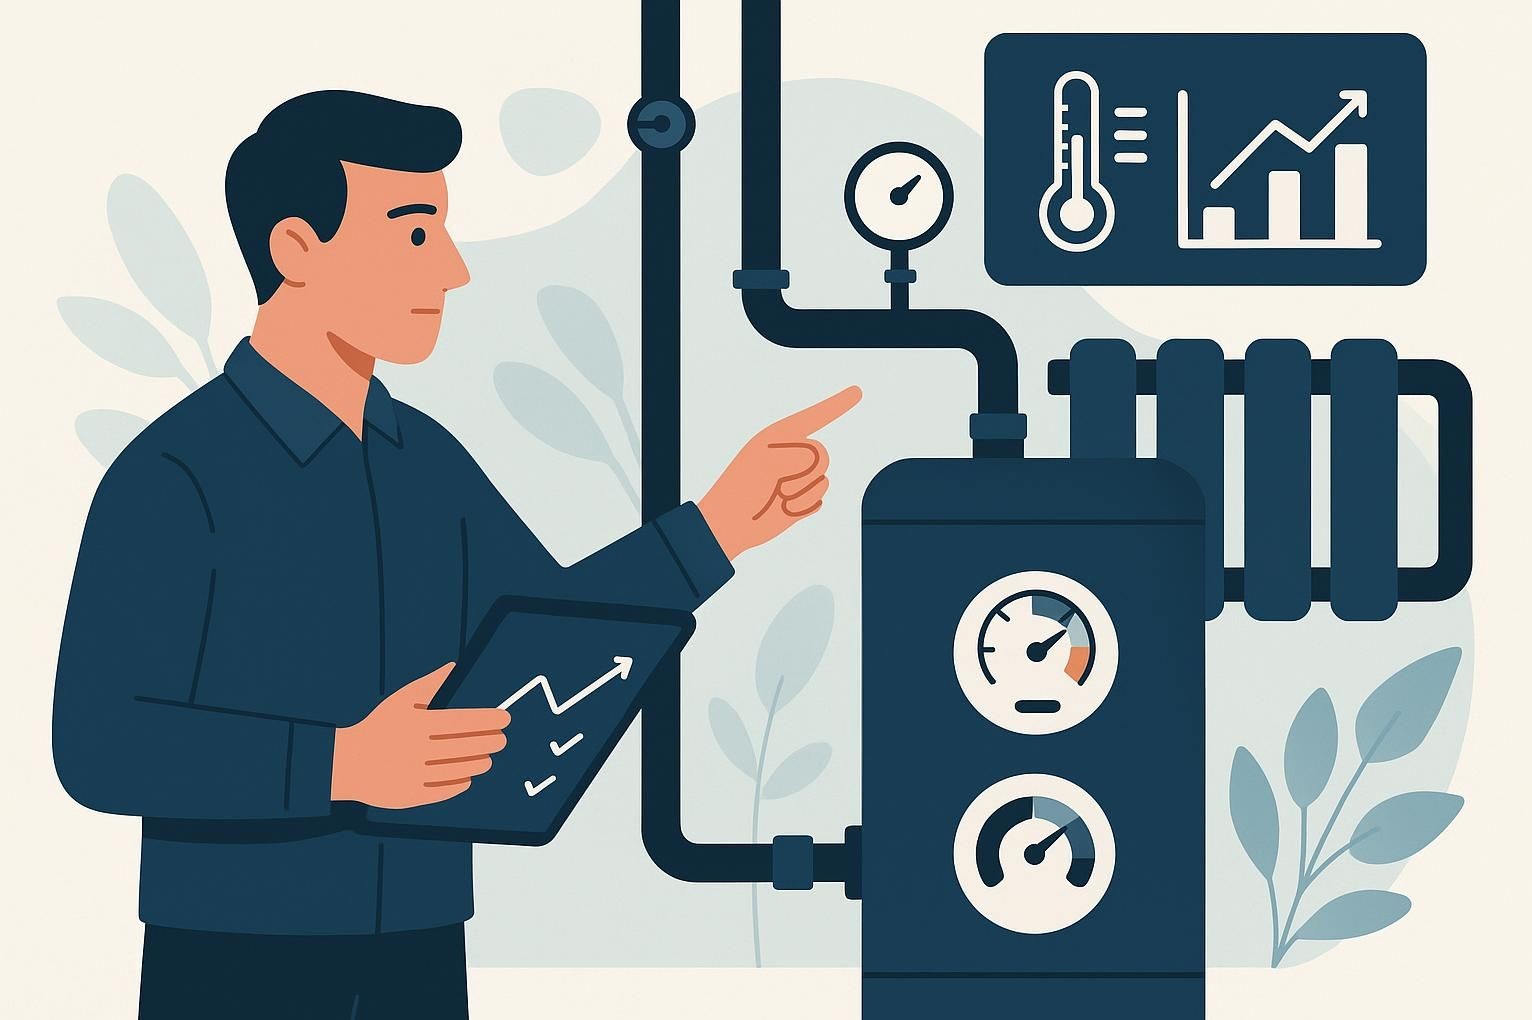
System diagnostics uncovers exactly the faulty operating patterns in existing heating systems that stay hidden during normal operation, unstable temperatures or a poorly calibrated heating curve, for instance. You compare operating data against known fault patterns and spot early where a system is drifting off course, long before tenants complain or a hefty year-end bill lands on your desk.
For housing companies managing many systems across a portfolio, replacing a single boiler rarely stops efficiency losses on its own. What matters is knowing which heating system needs attention first, and how you actually recognize that.
Three figures show just how wide the gap is between day-to-day operation and the real condition of many existing systems:
- 69 percent of centrally heated residential buildings in Germany still haven't had a hydronic balancing (hydraulischer Abgleich) performed.
- Unbalanced systems waste around 3 billion euros in heating costs across Germany every year.
- 75 percent of property management companies missed the statutory deadline for balancing larger portfolios.
- Monitoring followed by optimization cuts tenants' utility costs by up to 20 percent.
What Does System Diagnostics Mean for Heating Systems in Existing Buildings?
System diagnostics is the systematic analysis of a heating system's operating data to find the actual cause behind a fault. A fault alert only tells you that something is off. What's actually behind it only becomes clear once you analyze the operating data.
In existing buildings, this distinction gets overlooked constantly. After every breakdown, a component gets swapped, the heating curve gets readjusted, or the boiler pressure gets topped up, without anyone checking whether the same system will act up again in three months. Yet the systems that keep causing trouble again and again are exactly the ones sending the real warning signal.
Digital systems, such as connected heating systems with continuous data logging, are what make this kind of analysis practical in the first place, because they make operating data comparable over weeks, not just around a single maintenance visit.
Which Fault Patterns Stay Hidden Longest in a Heating System?
The faults that stay hidden longest are the ones that never trigger an alarm, unstable temperatures or unfavorable cycling, for example, patterns that only reveal themselves over weeks.
- Unstable supply or room temperatures: Tenants notice the fluctuations first, even though the equipment is technically still running.
- Unnecessary run times: Pumps and boilers keep running on old schedules, regardless of actual demand.
- A poorly calibrated heating curve: the most common cause of inefficient operation, usually only visible once the annual bill arrives.
- Short cycling: frequent on-off switching of heat generators that drives up wear and consumption at the same time.
- Outliers in consumption or return temperature: individual apartments or risers that consistently fall outside the normal range.
- Recurring fault alerts without a clear root cause: the same error code, several times a year, with no documented fix.
According to dena's dossier on monitoring in residential building boiler rooms, without ongoing data analysis, the annual heating bill is often the only moment an operating problem ever surfaces. By then, the system has already been running inefficiently for months.
Rule of thumb for short cycling: Manufacturers recommend 6 to 12 starts per hour for heat generators. A correctly sized buffer tank reduces cycling frequency by 20 to 60 percent, according to industry sources. Typical causes such as oversizing and a missing separation between combi storage tanks are also confirmed by the Fraunhofer ISE field study "WP-QS im Bestand," though mostly for single- and two-to-three-family homes. That magnitude should therefore only be applied to large multifamily portfolios with caution.
Why Does a Late System Diagnosis in the Boiler Room Get Expensive?
When a fault gets caught late in an existing building, several things usually pile up at once: months of energy losses, an expensive emergency callout, and, on top of it, a missed statutory deadline. An unclear situation in the boiler room rarely affects just one single system in the portfolio.
Hydronic balancing cuts heating energy consumption by an average of around 10 percent, according to a co2online analysis of more than 93,000 buildings; other industry sources put the figure at up to 15 percent. Nationwide, around 22 billion euros in savings potential goes unused, according to the Heizspiegel 2025, simply because hydronic balancing, pump replacement, or pipe insulation never get checked.
Statutory deadlines are putting additional pressure on property management companies. According to the VDIV, three-quarters of the property management companies surveyed missed the deadline for hydronic balancing in larger portfolios.
Good to know: Since October 2024, Section 60c of the German Building Energy Act (GEG) has required hydronic balancing for every newly installed heating system. Section 60b additionally requires the inspection and optimization of water-based existing systems in buildings with six or more residential units, installed before October 2009, with a deadline of September 30, 2027. The planned Building Modernization Act (Gebäudemodernisierungsgesetz) will replace the GEG and takes a more technology-open approach to heating systems overall, but it still requires documented proof of system condition, regardless of the energy source chosen.
An undetected fault also hits your budget in the short term. An emergency callout typically costs between 100 and 300 euros, plus surcharges of 50 to 150 percent for evenings, weekends, or holidays. A planned diagnosis, by contrast, happens during the day, giving you the time to get to the actual cause without the pressure.
Monitoring, Diagnosis, or Optimization: What's the Difference in Heating Operations?
Monitoring delivers the ongoing readings, diagnosis assigns them to a cause, and optimization then changes the control logic itself. Mix up these three levels and you'll quickly mistake a simple data display for an actual diagnosis.
Monitoring continuously displays values such as supply temperature, consumption, or run times in real time. For many questions, that's already enough: you can see at a glance whether a system is currently running normally. But when a pattern repeats over days or weeks, the same short cycling every morning, for instance, diagnosis takes over and turns individual data points into an actual cause.
Optimization only kicks in after that: control parameters get adjusted and heating curves recalibrated. According to dena/KEDi, monitoring combined with follow-up optimization cuts tenants' utility costs by up to 20 percent, and landlords get documented proof for GEG inspection obligations in the same process. Without diagnosis, you're just looking at numbers and still have no idea which system needs attention first.
What Data Does a Reliable System Diagnosis Actually Need?
A reliable system diagnosis needs continuous time series data spanning several weeks. Only by tracking the trend can you tell whether a reading is a genuine ongoing fault or just a one-day outlier.
- Temperature trends: supply, return, and room temperature over several weeks, not just on the day of the maintenance visit.
- Switching and cycling patterns: how often and how long heat generators and pumps switch on and off.
- Component run times: whether pumps and circulation loops keep running even outside the heating season.
- Consumption data over time: individual risers or apartments that consistently deviate from the portfolio average.
- Time-stamped fault history: whether the same error code keeps recurring, and exactly when.
These data patterns give technical teams clear priorities to work from: a system with recurring short cycling and rising consumption moves to the top of the task list, while a system with stable readings can wait. A practical example from the dena dossier shows this effect in concrete terms: at a housing cooperative in Hamburg, digital monitoring of a district heating substation with an IoT gateway and sensors cut consumption by around 8 percent, because the deviation became visible for the first time and could finally be prioritized.
Software such as KUGU VIS Anlagendiagnose, part of the KUGU Energieplattform, is one example of how these data patterns can be analyzed automatically and turned into concrete recommendations for technical teams, regardless of which manufacturer built the system in question.
What Does the Housing Industry Gain From Systematic System Diagnosis?
With systematic system diagnosis, you're no longer flying blind between two annual billing cycles. Technical teams get documented priorities to work from instead of guesswork, for maintenance callouts and for investment decisions alike.
A 2021 study by InWIS, commissioned by Aareon and still the most recent German industry survey on the topic, shows how decision-makers in the housing industry view predictive maintenance: 79 percent see it as a tool for managing service providers more efficiently, 80 percent expect better planning of maintenance measures, and 74 percent expect more reliable budget planning.
For technical managers, that translates into something very practical: less time spent hunting for the problem and more time actually fixing it. Diagnosis also gives investment decisions a solid foundation: which system genuinely needs replacing, and which one just needs a recalibrated heating curve.
System Diagnosis as an Early Warning System for Your Portfolio
A single metric from the boiler room tells you very little on its own. What matters is how the values connect: the more technology-open regulations become, and the planned Building Modernization Act is heading exactly in that direction, the more your portfolio's stability depends on the quality of your own data.
Waiting until a system acts up ends up costing you the emergency-callout rate. Analyze your operating data continuously instead, and work through your systems by priority rather than reacting to every single breakdown.
You can get started without any major groundwork: take an honest look at your own data situation. Which systems in your portfolio already deliver the time series data a reliable diagnosis needs, and which ones still don't?
Frequently Asked Questions About System Diagnosis for Heating Systems
How Often Should System Diagnosis Be Performed on Existing Heating Systems?
Continuously. Many faulty operating patterns only reveal themselves as trends over weeks, which is why a single annual check comes too late. On top of that, the GEG already requires regular, documented inspections for many existing systems anyway.
How Much Does an Emergency Callout Cost Compared to a Planned Diagnosis?
An emergency callout typically costs between 100 and 300 euros, plus surcharges of 50 to 150 percent for evenings, weekends, or holidays. A planned diagnosis takes place during the day and gets to the actual root cause under far less time pressure.
When Does the Statutory Inspection Requirement for Existing Systems Under the GEG Apply?
Since October 2024, hydronic balancing has been mandatory for every newly installed heating system. For water-based existing systems in buildings with at least six residential units, installed before October 2009, the deadline for inspection and optimization runs until September 30, 2027.
How Can You Spot Short Cycling in Heat Pumps Early?
Short cycling shows up as a noticeably high number of on-off switches, well above the manufacturer-recommended 6 to 12 starts per hour. It's usually caused by oversizing, unfavorable hydraulics, or a buffer tank that's too small, and retrofitting one can cut cycling frequency by 20 to 60 percent.
What Return Temperature Should You Aim For With District Heating?
The target value is a return temperature of around 45 degrees Celsius or lower. Lowering it from 70 to 60 degrees can noticeably increase a district heating network's capacity without requiring any physical network expansion.