Heat Pump Electricity Consumption: Annual Costs and Optimization

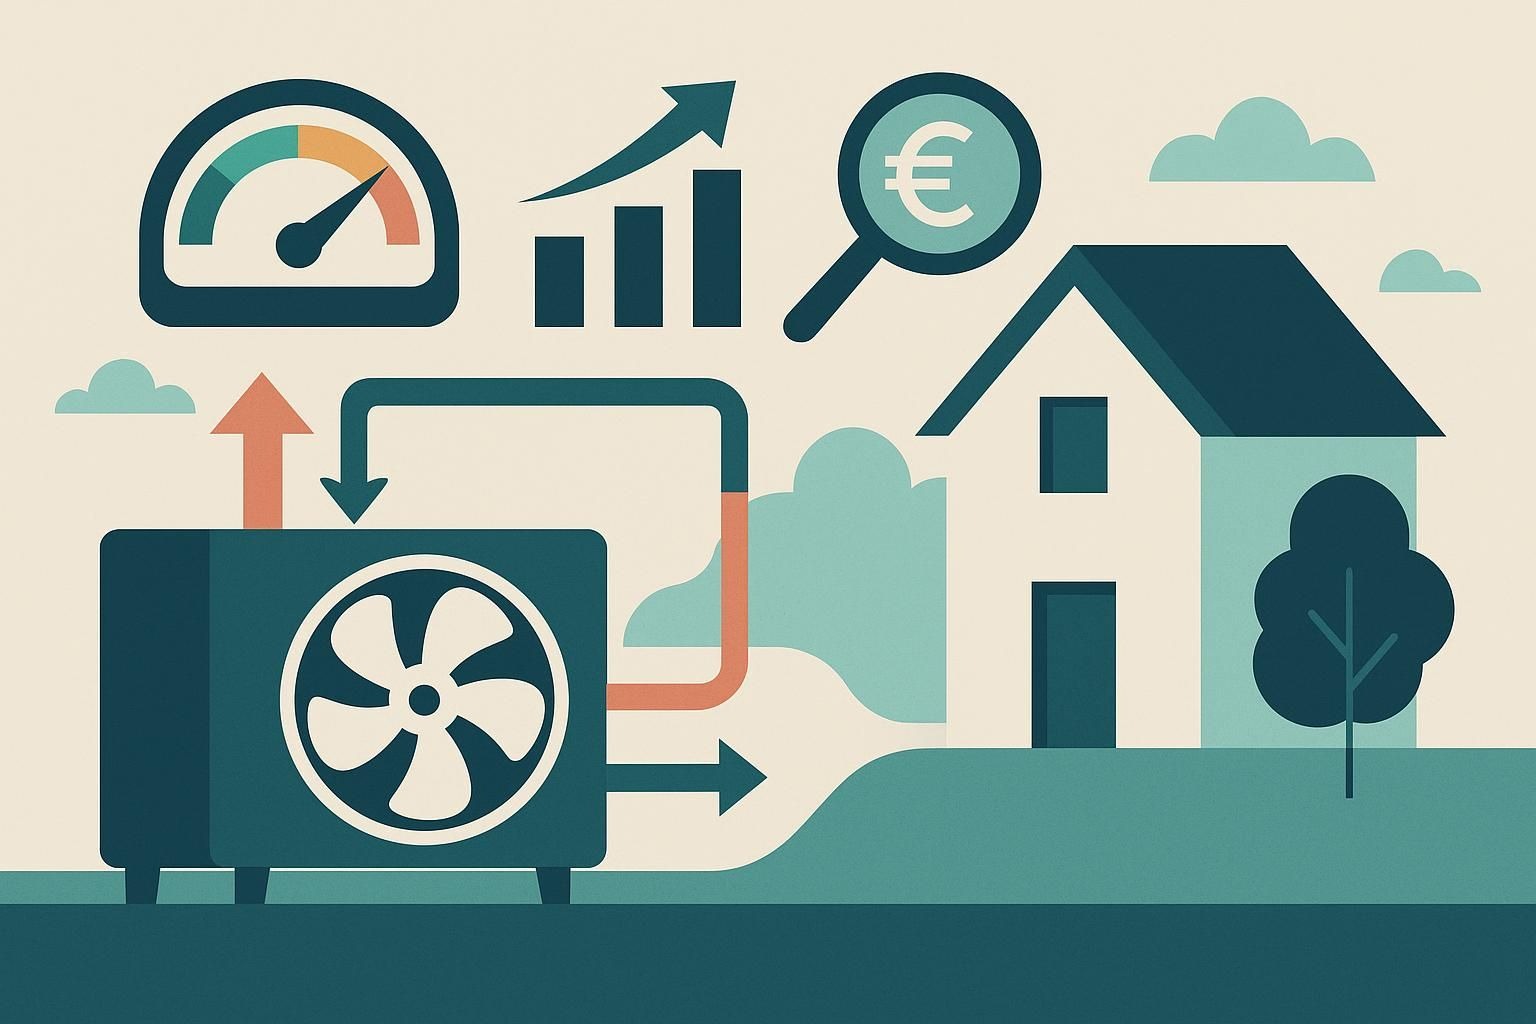
An air-to-water heat pump in a single-family home typically uses 4,000 to 6,000 kWh of electricity per year, depending on the building and the system's coefficient of performance (COP), which works out to roughly 800 to 1,680 euros a year at a heat pump electricity tariff of 20 to 28 cents per kWh. On cold days, daily consumption can climb to 20 to 35 kWh, and the months of November through February alone account for 50 to 75 percent of total annual consumption.
Where you land within these ranges depends above all on the system's annual coefficient of performance (COP). Flow temperature and building size also play a role. For operators managing several properties, there's an added layer: heat pumps across a portfolio rarely run at the same efficiency, and without measurement data, that usually goes unnoticed.
- Electricity consumption per square meter averages around 36 kWh a year, ranging from 27 to 42 kWh depending on the building's condition.
- Lowering the flow temperature by 8 degrees can raise the COP from 3.4 to 4.0 and cut consumption by around 15 percent.
- Heat pump electricity tariffs cost around 20 to 28 cents per kWh in 2026, well below the average household electricity price of about 37 cents.
- According to Fraunhofer IEG, dynamic electricity price control cuts costs by up to 30.4 percent on average when an energy management system automatically shifts operation.
How much electricity does a heat pump actually use per year?
For a single-family home with around 150 square meters of living space, an air-to-water heat pump's annual consumption usually lands between 4,000 and 6,000 kWh, though individual cases can range from 3,000 to 7,500 kWh. These figures are based partly on market data from gruenes.haus and serve as a rough guide for estimating costs in individual cases.
Relative to living space, that works out, according to the consumer organization co2online, to a specific consumption of roughly 27 to 42 kWh per square meter per year, averaging around 36 kWh/m². For 150 square meters, that puts the average at around 5,400 kWh a year.
What this means in euros depends heavily on the electricity tariff. The average household electricity price, according to the BDEW electricity price analysis 2026, sits at around 37 cents per kWh, while dedicated heat pump tariffs run 20 to 28 cents, partly thanks to reduced grid fees under Section 14a EnWG. At 5,400 kWh of annual consumption, that's the difference between nearly 2,000 euros at the household rate and roughly 1,100 to 1,500 euros at the heat pump rate.
How high does electricity consumption climb in winter, on frost days?
On cold winter days, a heat pump in a single-family home can draw 20 to 35 kWh of electricity per day, well above what the annual average of just under 15 kWh per day might suggest. According to Thermondo, these peak figures apply specifically to genuine frost days; averaged across the whole winter, the daily figure is noticeably lower.
November through February account for 50 to 75 percent of total annual consumption. In summer, by contrast, consumption often drops below 150 kWh a month, since the heat pump is then mostly just heating domestic hot water.
Good to know: Winter daily consumption fluctuates strongly with outdoor temperature, so it tracks the weather more closely than the calendar month. A January with several frost spells drives up costs more than a mild February, even though both months count as part of the heating season on paper.
How do COP, flow temperature and hot water drive electricity consumption?
The coefficient of performance (COP) describes how much heat a heat pump generates from one kilowatt-hour of electricity, making it the single biggest lever on electricity costs. The most comprehensive German field study to date, the Fraunhofer ISE project "WP-QS im Bestand", measured 77 systems over four years: air-to-water heat pumps averaged a COP of 3.4 (range 2.6 to 4.9), while ground-coupled brine-to-water systems reached 4.3 (range 3.6 to 5.4).
A calculation example for a 140 square meter, partially renovated existing building with a heat demand of 15,000 kWh a year shows just how much a weak COP drives up costs: at a COP of 3.5, the system needs around 4,286 kWh of electricity, while at a COP of 4.5, consumption drops to 3,333 kWh, a difference of about 22 percent from efficiency alone.
Flow temperature feeds directly back into the COP. In a calculation example from 42watt, lowering the flow temperature by 8 degrees raises an air-to-water heat pump's COP from 3.4 to around 4.0 and cuts consumption from 4,412 to 3,750 kWh a year, a drop of roughly 15 percent. Each degree of lower flow temperature saves around 2 to 2.5 percent of electricity.
One notable finding from the Fraunhofer ISE study: it found no link between a building's construction year and heat pump efficiency. Sufficiently sized radiators in existing buildings allowed for flow temperatures nearly as low as those achieved by underfloor heating in new construction. That undercuts the common assumption that heat pumps only run economically in renovated new builds. Hot water remains a separate cost factor on top of this, since the higher temperatures it requires lower the COP regardless of the heating curve.
Heat pump types compared: what do air-to-water, brine-to-water and water-to-water systems cost?
Brine-to-water heat pumps use noticeably less electricity than air-to-water systems for the same heat demand, because the more stable ground temperature allows for a higher COP. The table below summarizes the Fraunhofer ISE averages for an existing building with a heat demand of 15,000 kWh a year.
| System type | Typical COP (range) | Electricity use at 15,000 kWh heat demand | Cost at heat pump tariff (24 ct/kWh) |
|---|---|---|---|
| Air-to-water | 3.4 (2.6-4.9) | approx. 4,412 kWh | approx. €1,059 |
| Brine-to-water | 4.3 (3.6-5.4) | approx. 3,488 kWh | approx. €837 |
For water-to-water heat pumps, no robust German field study with a comparable COP range currently exists, so no reliable figure can be given here. In practice, they're often considered similarly efficient to brine-to-water systems thanks to the stable groundwater temperature, though independent confirmation of that is still missing.
Why do operators rarely know the electricity consumption of individual systems in their portfolio?
Operators running multiple heat pumps rarely know the actual consumption of each individual system, because consumption data and load profiles are hardly ever evaluated systematically. A recent white paper from Fraunhofer IEE shows just how much this matters: for heat pump retrofits in multi-family buildings, grid connection cost contributions alone range from zero to more than 50,000 euros, depending on which standards and load assumptions the grid operator applies.
That's exactly why operators should gather solid consumption data before planning a new system, not after. The article Heat pump in multi-family buildings: what data is missing beforehand describes what data tends to be missing upfront and how that comes back to bite a project later on. Without load profiles and temperature curves from actual operation, any statement about an existing system's electricity consumption or COP remains a guess.
A digital building twin creates transparency here. It continuously captures three values per system:
- Consumption: actual electricity use over time, not just an annual estimate.
- Flow temperature: measured real-world values from the heating curve during operation.
- Cycling behavior: start and run times as an indicator of hydraulic problems.
Matched against comparison values from the rest of the portfolio, this makes it possible to see which system is running at a COP of 2.8 and which at 4.5, a gap that quickly adds up to several hundred euros a year in electricity costs for the same heat demand. Once these differences are known, operators can fine-tune the heating curve and hydraulics for the specific systems that need it, rather than investing across the entire portfolio.
How does dynamic electricity price control cut costs without sacrificing comfort?
Dynamic electricity prices automatically shift heat pump operation into cheaper hours, cutting electricity costs without residents noticing any difference. Since January 1, 2025, every electricity supplier in Germany has been required under Section 41a EnWG to offer at least one dynamic tariff, with prices adjusting hourly based on the wholesale electricity market.
The Fraunhofer Institute for Energy Infrastructures and Geothermal Systems (IEG) looked into how much this actually saves: averaged across all households studied, the savings potential reached up to 30.4 percent, but only where an energy management system actually adjusted operation automatically in response to price signals. Without automated control, a dynamic tariff mostly remains untapped potential, since nobody manually adjusts heating hour by hour.
EOS Strompreisdynamik, a feature of the KUGU EOS energy optimization system, handles this control automatically. The module links a building's forecasted heat demand with wholesale electricity prices, for example from EPEX Spot. Based on that, it controls the heat pump and buffer storage, supplemented where needed by solar power and battery storage. EOS Strompreisdynamik shifts operation into economically favorable hours this way, while comfort and hot water hygiene stay fully protected throughout. The balance between maximum energy efficiency and minimum electricity costs can be adjusted depending on the portfolio.
Section 14a EnWG adds another dimension: since January 1, 2024, the rule has applied to controllable consumption devices such as heat pumps with a connected load of 4.2 kW or more. Grid operators are allowed to temporarily throttle supply during bottlenecks, and in return, operators receive permanently reduced grid fees through one of three selectable modules. Combining this mechanism with automated price control brings savings on two fronts at once, both grid fees and the per-kWh electricity rate. The article Electricity price optimization for heating systems: how to cut costs describes how this can be applied systematically across entire heating portfolios.
The interplay with a building's own solar generation adds to the same equation. Without battery storage, the heat pump-solar combinations examined in the Fraunhofer ISE field test reached 25 to 40 percent self-sufficiency; with battery storage, that rose to 32 to 62 percent. The article Sector coupling in buildings: making it economically viable in existing stock explores how heat pumps, storage and electricity price signals can be brought together in existing buildings.
What does this mean for your heat pump electricity costs next year?
The biggest lever is usually the interplay between flow temperature, heating curve and system load. That runs in the background of every system, yet in day-to-day operations, rarely anyone looks closely. A system with a COP of 2.8 and an identical unit with a COP of 4.5 in the same portfolio can differ by several hundred euros a year in electricity costs, even though both look the same on paper.
For a single building, a reviewed heating curve is often enough to noticeably cut electricity use. For portfolios with dozens or hundreds of systems, this turns into a question of data: without ongoing measurements, it stays unclear which system actually needs optimizing in the first place. The sensible next step, then, is to make the current state of each system visible before deciding on new tariffs or new technology.
Frequently asked questions about heat pump electricity consumption
How much electricity does a heat pump use per day on average?
Averaged over the year, daily consumption for an air-to-water heat pump in a single-family home runs around 11 to 16 kWh, derived from an annual consumption of 4,000 to 6,000 kWh. On cold winter days, this figure rises sharply to 20 to 35 kWh, while in summer it often falls below 5 kWh.
Is a dedicated heat pump tariff worth it compared to standard household electricity?
Yes, heat pump tariffs mostly cost 20 to 28 cents per kWh in 2026, roughly 9 to 17 cents below the average household electricity price of about 37 cents. At an annual consumption of 5,000 kWh, that adds up to a difference of around 450 to 850 euros in electricity costs per year.
How much does a better coefficient of performance actually lower electricity costs?
At the same heat demand of 15,000 kWh, electricity consumption drops from around 4,286 kWh at a COP of 3.5 to about 3,333 kWh at a COP of 4.5, a decrease of roughly 22 percent. At a heat pump tariff, that translates to savings of roughly 200 to 300 euros a year.
Do heat pumps in unrenovated older buildings use significantly more electricity?
Not necessarily, since the Fraunhofer ISE field study found no statistical link between construction year and heat pump efficiency. What mattered instead was whether the existing radiators were sized large enough to operate at low flow temperatures, which was often the case even in older buildings.
At what point does automated electricity price control pay off for heat pumps in a portfolio?
Automated control pays off as soon as a building has access to a dynamic electricity tariff and the heat pump has enough buffer storage to shift operation in time. According to Fraunhofer IEG, the savings potential of dynamic prices, up to 30.4 percent, can only be realized in practice with an energy management system; manual control typically fails to capture it.