Heizungsmonitoring for Multi-Family Buildings: Data, Alerts, ROI

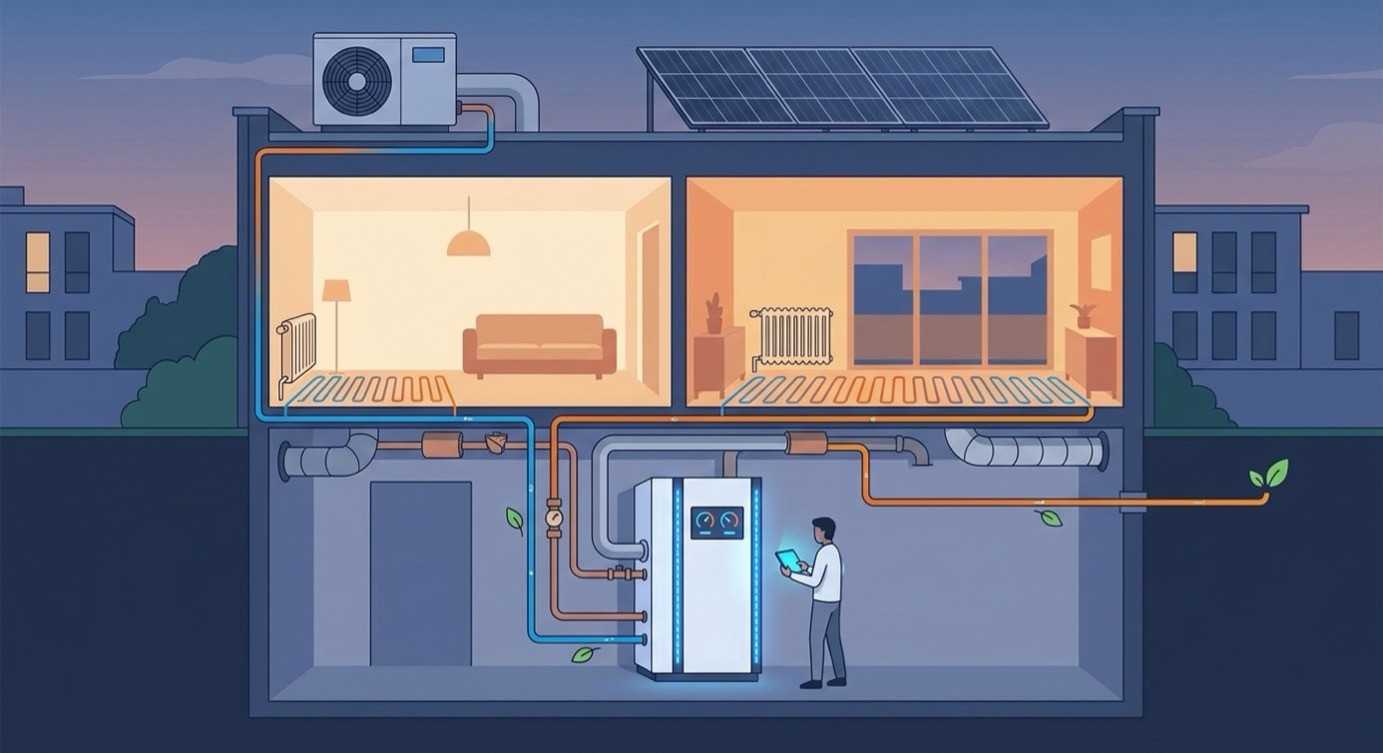
Heating monitoring makes the day-to-day operation of a heating system in a multi-family building visible long before the annual statement offers its first clues. Excessive flow temperatures, poorly set heating curves and unnecessary cycling show up early, faults get spotted faster, running costs come down, and tenant comfort stays protected.
If you only track how a system runs through the yearly heating bill, you often notice misconfigurations and faults months too late. By then, a flow temperature set too high or a pump running non-stop has long since burned through energy and money. Figure on projected heating costs of around 1,180 € for a 70-square-metre gas-heated flat in a multi-family building, and those operating faults add up across a whole portfolio to amounts you can feel.
Several steps sit between the first readings and the economic decision, and each one demands a different level of attention in existing buildings:
- Reliable monitoring needs temperatures, consumption, heat quantities, run times and spot checks on the indoor climate, all captured in short intervals.
- Warning signals such as excessive flow temperatures, pumps running around the clock or wrong heating curves point straight to their cost and comfort consequences.
- Across whole portfolios, monitoring shows which buildings need budget, service or renovation planning first.
- Monitoring creates transparency; the actual saving only comes from optimisation, for instance with KUGU VIS for visibility and KUGU EOS for control.
What data does heating monitoring in a multi-family building need?
This is not about collecting as many readings as possible. It is about exactly the data you can turn into operating decisions. Every block of data should answer a concrete question: does the system run plausibly, are there operating faults, does comfort hold up, and where do the costs arise? The overview below sorts the main categories by their value to operators.
| Data category | Typical measurement points | Operator decision it enables |
|---|---|---|
| Temperatures | Outdoor air, flow and return temperature | Check plausibility of operation, spot excessive flow temperatures |
| Consumption | Gas, oil or electricity use | Make cost drivers visible and prioritise them |
| Heat quantities | Heat generated and transferred | Assess efficiency of generation |
| Run times and starts | Operating hours, starts, hours per start | Judge cycling and wear |
| Pump operation | Operating signal of the circulation pump | Uncover non-stop runners and a missing heating limit |
| Trend and load profile data | Readings over time on a 15-minute grid | Spot patterns and derive alarm thresholds |
| Indoor climate spot checks | Room air temperature, hours above and below target | Protect tenant comfort |
Temperatures and run times
Temperatures and run times are the technical backbone of any assessment. They tell you whether a system works to actual demand or simply runs on a fixed pattern. The technical inspection framework names different core figures depending on the type of system. For a gas condensing boiler that includes utilisation rate, exhaust temperature, operating starts and operating hours per start; heat pumps add coefficient of performance, electrical energy and flow rates. For trends and anomalies to become visible at all, the relevant figures should as a rule be captured as instantaneous values in intervals of no more than 15 minutes, and shorter where needed.
On the heating circuit, the operating signal of the circulation pump is especially telling. It reveals non-stop runners and a missing heating limit, meaning heat that keeps being distributed even when nobody needs it. At district heating transfer stations, the primary and secondary flow and return temperatures, together with the heat transferred, are the decisive figures for checking whether the handover holds up.
Linking heating data to comfort
Heating data on its own says nothing about whether the flats are actually warm enough. That is why the indoor climate belongs in the picture, sampled rather than measured everywhere. It makes sense to measure in at least two rooms, and from 20 rooms onwards in roughly ten percent of them, using room air temperature and the permitted hours above and below target as core figures. That way an efficiency measure can be checked against real tenant comfort, instead of saving money at the tenants' expense.
Worth knowing: For reliable monitoring, temperatures, heat quantities, consumption and run times are enough, usually captured through retrofittable clamp-on sensors, heat meters and a gateway. Additional figures like flow rates, exhaust values or dense indoor-climate data only become necessary once you move into diagnosis or active optimisation.
Which alarms reveal faulty operation in the boiler room?
The most important alarms flag operating anomalies that otherwise slip through daily routine and often only surface through the annual statement as the only feedback. By then the wasted energy is long since paid for. Good monitoring therefore translates technical deviations into early economic warnings. These patterns deserve particular attention across a portfolio:
- Excessive flow temperature: drives up losses and gas consumption without adding any comfort.
- Wrongly set heating curve: the system heats past actual demand, often too much in mild weather.
- Excessive cycling: frequent burner starts increase wear and lower the utilisation rate.
- Pump running with no heating limit: causes electricity costs and heat distribution even outside the heating season.
- Recurring service call-outs with no root cause found: point to an underlying problem that is treated, not solved.
Behind these alarms sit exactly the adjustable parameters that the statutory heating inspection also looks at: flow temperature, heating curve, night setback and heating limit temperature. Seeing these values continuously lets you catch a wrong setting in days rather than in a full billing year, and lets you schedule the service call precisely instead of repeating it over and over. For tenants that means steadier running costs; for operators, less risk of breakdown and more predictable technology.
How does monitoring prioritise entire building portfolios?
Across several properties, the real value of monitoring lies in the sequence: it shows which buildings should get attention, budget or service capacity first. For housing companies and property managers, comparability across the whole portfolio counts for more than the depth of detail on a single system. These criteria carry a sound prioritisation:
- Conspicuous consumption values compared with similar buildings, as a first sign that action is needed.
- Recurring alarms and comfort deviations that point to unresolved operating problems.
- Frequent service call-outs and high return temperatures as markers of technical inefficiency.
- Upcoming renovation or heating replacement, where operating data supplies the right sizing.
- Reporting capability for GEG evidence and ESG or sustainability reports.
For a rough orientation it helps to look at benchmark figures, for instance the roughly 90,000 records of centrally heated residential buildings, evaluated separately for single-family, two-family and multi-family homes. Such classes show where a building stands out, but they never replace building-specific operating data. And it is exactly that data which sharpens the concrete decisions: the order of technical inspection, where the budget goes, how service providers are steered, and the preparation of modernisation and heating replacement.
Where does heating monitoring end and optimisation begin?
Heating monitoring ends where operation is visible and assessed. Optimisation begins with active intervention in the control system. Technical monitoring checks whether a system reaches its functional targets. It is neither a planning nor an installation service, and it is not full commissioning management. This clean boundary matters, because monitoring on its own does not save a single kilowatt-hour.
Our own offering fits into that same picture. KUGU VIS, the Visuelles-Informationssystem, works as the transparency and diagnosis layer: VIS Betriebstransparenz delivers dashboard and alerting, VIS Anlagendiagnose assesses efficiency and gives technical recommendations. KUGU EOS, the Energie-Optimierungssystem, builds on that and takes over the actual optimisation, using a digital building twin to calculate suitable flow temperatures and match heating phases to real demand.
How much efficiency this separation actually delivers shows best in digitised existing heating systems, where transparency and control work together.
Which GEG obligations does digital heating monitoring touch?
For heating systems in buildings with six or more residential units, the inspection and optimisation obligations under GEG §§ 60a and 60b apply. For systems installed before 1 October 2009, the inspection deadline under §60b runs until 30 September 2027. The manual inspection can be waived if the system is continuously monitored and meets the requirements for standardised building automation under §71a.
Digital monitoring is therefore a practical way to demonstrably meet obligations such as keeping an eye on flow temperature, heating curve and night setback. Some aspects, though, stay a physical visual inspection, for example the insulation on pipes and fittings. If you want a low-threshold entry point, you will find it in the digital boiler room.
From heating monitoring to a decision on measures
Data alone lowers no heating costs. But without data, operation, prioritisation and optimisation all stay blurry. Only the combination of a clean data base, understood alarm patterns and a prioritisation across the portfolio turns a vague hunch into a well-founded decision on measures. Transparency in ongoing operation is the economic lever, because it makes operating faults visible before they cost money for a whole heating season.
For implementation, a sober separation of the levels pays off: KUGU VIS provides visibility and diagnosis, KUGU EOS the subsequent optimisation and control. It is just as useful to rank the portfolio by urgency and tackle the most conspicuous buildings first, rather than deciding across all properties at once.
The concrete next step is to take stock of the operating data you already have and to sort it clearly: what is a monitoring target, what is a diagnostic need, and what is an optimisation decision? On that basis, budget, service capacity and renovation planning become far more accurate.
Frequently asked questions (FAQ)
Is heating monitoring mandatory in a multi-family building?
Not across the board. But for heating systems in buildings with six or more residential units, inspection and optimisation obligations apply under GEG §§ 60a and 60b. They affect older water-based systems from 15 years of age as well as new heat pumps. Whether monitoring serves to meet these obligations depends on the specific case, the system type and the size of the building.
What is the minimum sensor setup an existing building needs?
As a basic kit, temperature sensors, a heat meter, a controller and, where needed, a radio module are usually enough, complemented by electronic consumption meters. In residential buildings this sensor set can as a rule be retrofitted with minimal intervention. Depending on the system type, selected figures are added, such as the exhaust temperature on a boiler or the coefficient of performance on a heat pump.
How often should heating data be measured?
At most every 15 minutes, and more often where needed: that is the usual orientation for the relevant figures. This interval is tight enough to reliably detect load profiles, trends and anomalies and to trigger alarms in time. It is a guideline, not a rigid requirement for every single system.
Which alarms matter most in the boiler room?
The most important are excessive flow temperatures, wrongly set heating curves, excessive cycling and pumps running with no heating limit. Each of these alarms points to a concrete decision: readjust control parameters, adapt the heating curve, check burner operation or correct the pump control. That way cost and comfort consequences are contained early.
Can monitoring save energy without any intervention?
Only to a limited extent. Monitoring creates transparency and uncovers savings potential; the actual saving only comes from the optimisation that follows. Visible operating faults have to be corrected for consumption and costs to fall. Heat savings of up to 20 percent are achievable when the data is followed by a measure or a control system such as KUGU EOS.
How does heating monitoring keep tenant comfort protected?
Through sample indoor-climate measurements in at least two rooms, using room air temperature and the permitted hours above and below target as reference values. That lets every efficiency measure be checked against real comfort. The point is target values per building, not surveillance of individual flats, so that comfort and falling running costs go together.